 Hi,
Hi,
we are Felix Harle and Prak Piakot, both design students at FH Potsdam (Felix interface- and Prak product design).
highlight

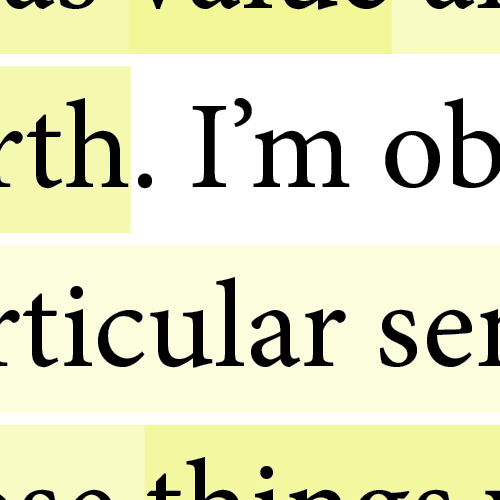
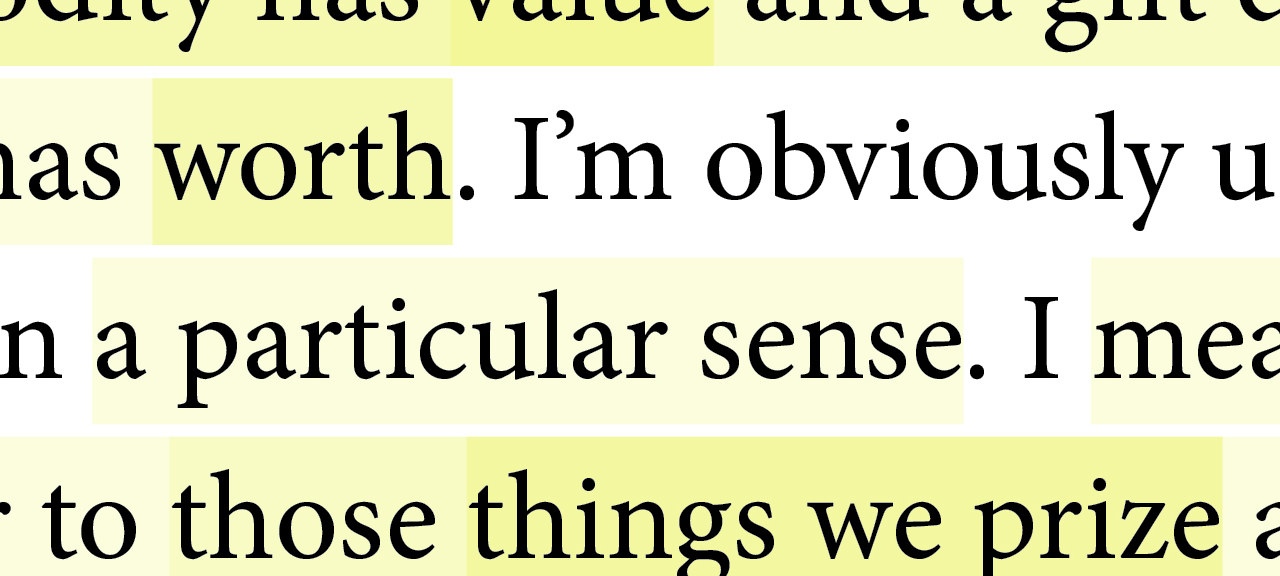
We set as our goal to create a script that uses highlight data as input (different people, same text) and outputs a visualization of it in the context of the original text in one InDesign document.
Basically, the script creates a text frame for each highlight and sets it's opacity to a low level. All these text frames are then stacked over each other, which results in adjoining transparencies in places that were highlighted by more than one person.
Launch the script to see our result or follow these steps to build your own visualization:
- Gather some markdown documents containing your text and the highlights (represented by bold text)
- Convert them into HTML using this tool by Daring Fireball (just paste the markdown content of your documents underneath each other in the same box and click "Convert")
- Copy the HTML output and paste it into our custom built tool below to extract the highlight data for use in InDesign
- Copy the output of our tool and paste it into the marked area in highlight.jsx (make sure to replace the text we used with the one you want to use as well)
- Save and run to get the visualization
- var highlight_data = [];
Note
A lot of copy and paste: sorry for that! Building a whole dynamic system unfortunately is beyond our scope and clearly wasn't the goal of this course. But the idea itself has potential in our opinion: think of a button on the new york times web version that enables "Highights" and visualizes the parts of the text that the 200 people who read the piece before you have found important. Time saved.
You can also clone the jQuery widget with Git by running:
git clone git://gist.github.com/3923596.git gist-3923596
License
This work is licensed under the Creative Commons Namensnennung-Nicht-kommerziell 3.0 Unported License.
To view a copy of this license, visit creativecommons.org/licenses/by-nc/3.0/
Copyright (C) 2012 Felix Harle, Prak Piakot
Everyone is permitted to copy and distribute verbatim or modified copies of this license document, and changing it is allowed as long as the name is changed.
